
There is no way around the problem of corrosion in power plants. Especially the desire for high steam temperatures and the use of different fuels pose new challenges for boiler manufacturers. What is required are boilers that are both economical and durable.
If a system suddenly stops, the question is immediately: “Why?” Possible causes are the operating conditions, the age of a system or high-temperature corrosion. High-temperature corrosion is influenced by the temperature profiles in the boiler area.
If you want to reduce this corrosion systematically, you need to know which areas in your plant are susceptible to corrosion. The Flingern diagram reveals this clearly. The diagram shows the corrosion resistance of pipe materials in the flue gas stream under varying operating conditions. The diagram was developed using empirical data gathered at the Düsseldorf-Flingern waste incineration plant; hence the name of the diagram.
The diagram is created in three simple steps: Once you have analyzed the boiler drawing (1) and flue gas and steam temperatures (2), you can enter the collected values in the diagram (3). You can immediately see whether your superheaters are in areas of high or low corrosion.
1. Identify the critical areas
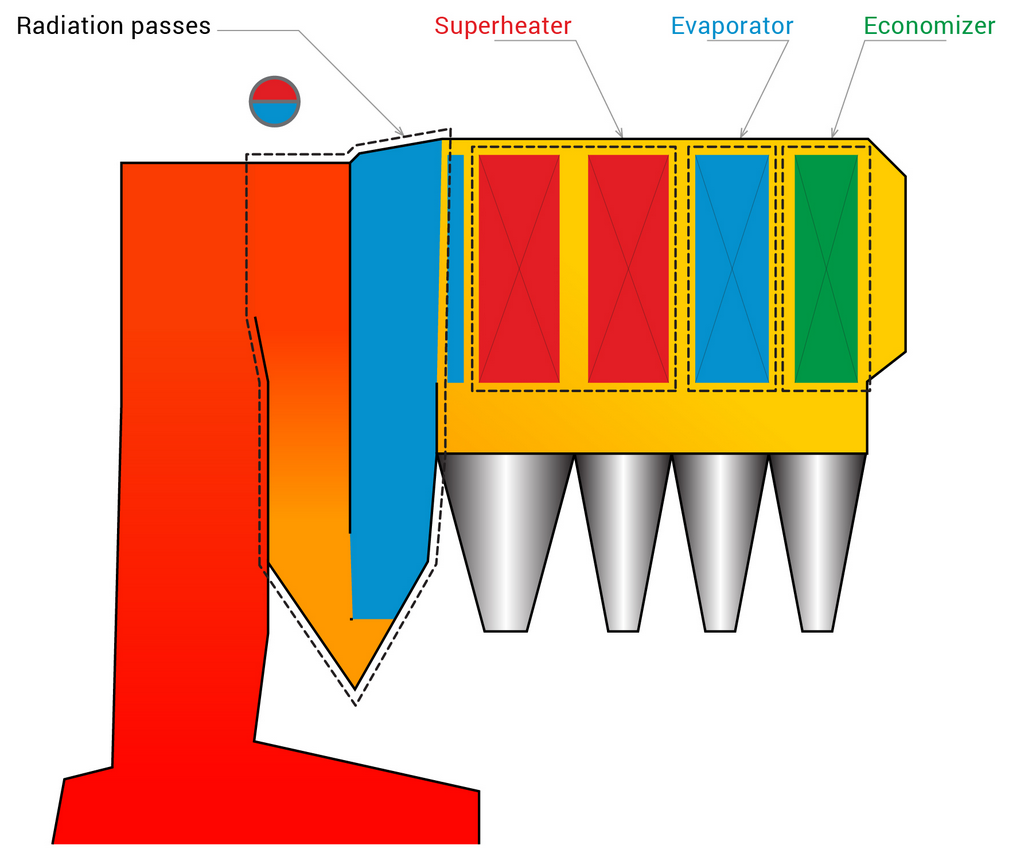
Analyze your boiler drawing and determine for which areas of your plant you want to create a Flingern diagram. The areas most susceptible to corrosion are those in which the highest external pipe wall temperatures occur.
- Determine the position of the superheater bundles in your boiler. A protective evaporator upstream of the superheaters can reduce temperature peaks as well as the risk of corrosion.
- Ask yourself where the critical points of your plant are: Which parts of the plant have the highest temperatures?
- The Flingern diagram below is valid for 16Mo3 steel pipes. Contrary to initial expectations, there was hardly any difference in the corrosion behavior of the various sampled pipe materials.
2. Step: Determine flue gas and steam temperatures
After you have identified the critical points, take a look at the temperature profiles during the boiler’s last operating period:
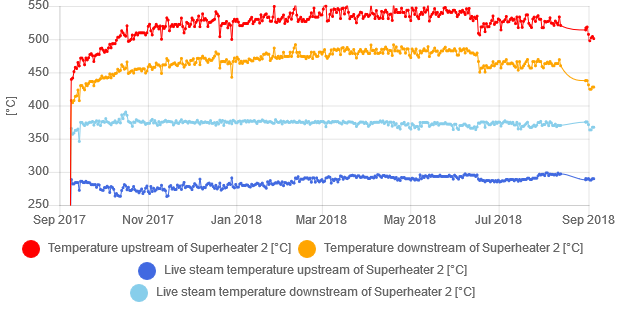
- Read the flue gas temperatures at the superheater pipes from the continuous measurements. (Figure 2)
- The temperature of the pipe wall corresponds approximately to the steam temperature. Read these from the existing measurements as well.
- The changes during the boiler’s operating period are also revealing: Is there a continuous increase in temperatures? This indicates increasing deposits in the boiler area.
- Note the maximum values for the critical areas. Brief temperature peaks can be ignored.
3. Step: Create the Flingern diagram
Enter the previously gathered flue gas temperature and pipe wall temperature (simplified = steam temperature) into the Flingern diagram (see figure 3).
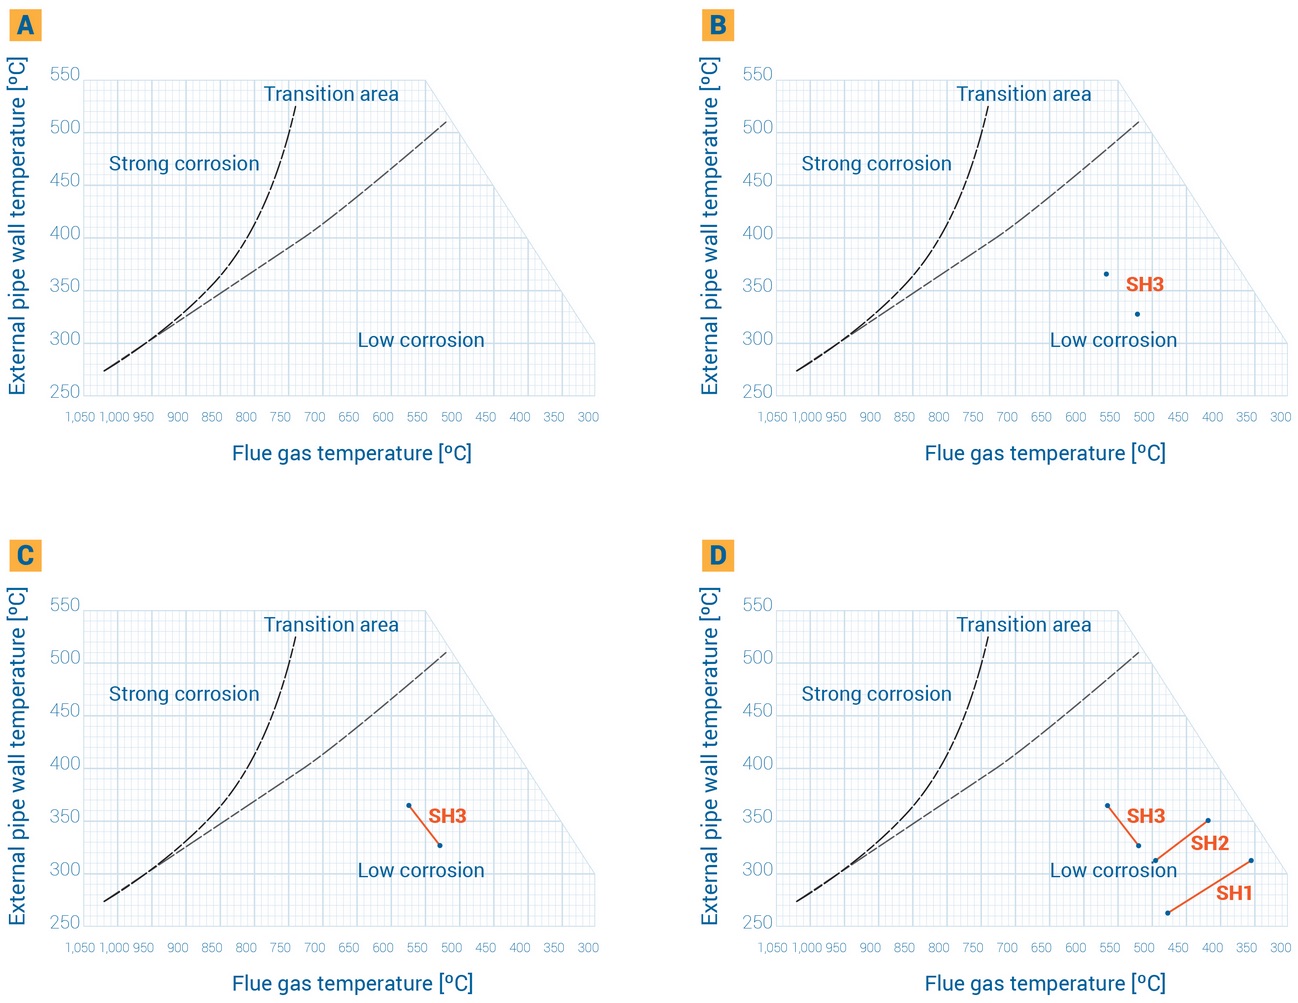
Entering the superheaters (example: Superheater 2)
A. Empty diagram
B. Dot 1: X axis: Flue gas temperature = maximum value temperature upstream of Superheater 2 (550°C), Y axis: Outer pipe wall temperature = maximum live steam temperature upstream of Superheater 2 (300°C)
Dot 2: X axis: Flue gas temperature = maximum value temperature downstream of Superheater 2 (495°C), Y axis: Outer pipe wall temperature = maximum live steam temperature downstream of Superheater 2 (390°C)
C. Connect dots
D. The same procedure for all other superheaters
Now you can easily read at which temperatures your pipes and boilers are at risk of corrosion. Set the operating parameters so that the flue gas and pipe wall temperatures are in the “low corrosion” range. (Figure 3)
Experience has shown that the Flingern diagram can be created for each plant bundle identified as critical in Section 1.
Conclusion and possible measures
With this method, every operator can relatively easily determine corrosion-critical areas in their plant’s superheaters using existing measured values.
In many European waste incineration plants the usual steam temperatures are around 400°C. In order to avoid increased superheater corrosion, the flue gas temperature upstream of the superheater must not exceed 650°C. (See blog post Four causes of superheater corrosion that any Waste to Energy plant operator will know only too well)
If the inspector determines that there is a risk of corrosion at certain points in his system, appropriate measures can be taken:
- Cleaning the empty passes or installing an upstream protective evaporator lowers the flue gas temperature in the superheater area. The superheater is shifted to the right in the corrosion diagram.
- Pipes at risk can be replaced by another material or protected through build-up welding.